Logging
Hotsock logs are written to CloudWatch Logs. By default, it writes informational info, warnings, and errors to logs. However, you have full control over the log volume, verbosity, and retention settings in your installation's settings.
Consolidated logging & retention
By default, all application logs from Lambda functions are written to the same CloudWatch Logs log group. This aggregates all log entries to one place for searching or following in real-time.
Consolidated logging also allows configuring a log retention policy for these logs so you're not paying for their storage forever. Log retention defaults to 90 days, but you can change this in your installation's settings.
System log settings
System logs are the logs that the Lambda service generates. These logs indicate the timing of when a Lambda function was invoked, how long it took, etc. There are 3 available log levels for system logs.
DEBUG: Detailed information for system debugging.INFO: Messages that record the normal operation of functions.WARN(default): Messages about errors that may have caused or may lead to unexpected behavior if unaddressed.
Learn more about Lambda logging controls in the official documentation.
Application log settings
This default log level is the "INFO" level. There are 4 log levels available. A given log level includes all logs from the levels below it.
DEBUG: Extremely verbose, attempts to log all user input data as well as all inputs and relevant outputs from AWS services. Includes INFO, WARN, and ERROR logs.INFO(default): Limited verbosity informational logs. Includes WARN and ERROR logs.WARN: Improper use of inputs, deprecation warnings, etc. Includes ERROR logs.ERROR: Unexpected errors that likely could not be recovered.
To minimize log volume while retaining important messages, WARN is a reasonable choice for high-throughput production installations. If you configure an installation for a development or staging environment, "DEBUG" can be a good choice so you can follow individual requests through Hotsock.
The DEBUG log level can incur significant costs on large-scale installations. Consider using this log level temporarily to capture logs for a given situation, then restore the setting to one of the less verbose log levels.
Additionally, the DEBUG level logs all messages as they are received and published, including the payloads. These entries may contain sensitive information. Be sure to review your CloudWatch Logs permissions and retention settings if you're enabling DEBUG logging for a production workload.
Tracing spans in logs
Hotsock can emit lightweight tracing spans as structured JSON application log records. These records have type: "app.span" and include fields such as traceId, spanId, parentSpanId, spanName, status, startEpochMs, and durationMs.
Tracing is sampled per trace and is configured by the CloudFormation "Tracing spans in logs sample rate (%)" (TracesInLogsSampleRateParameter via CLI) setting. The value is a percentage from 0 to 100; 0 disables tracing entirely. The default is 1, which samples roughly 1% of traces.
Sampled traces are correlated across Hotsock's asynchronous Lambda, SQS, SNS, and EventBridge hops where possible. Use the shared traceId to query related app.span records in CloudWatch Logs Insights.
Tracing spans are application log records, so they require the application log level to be INFO or DEBUG. They add log volume for sampled traces, so raise the sample rate temporarily when investigating an issue and lower it again when finished.
Change log settings
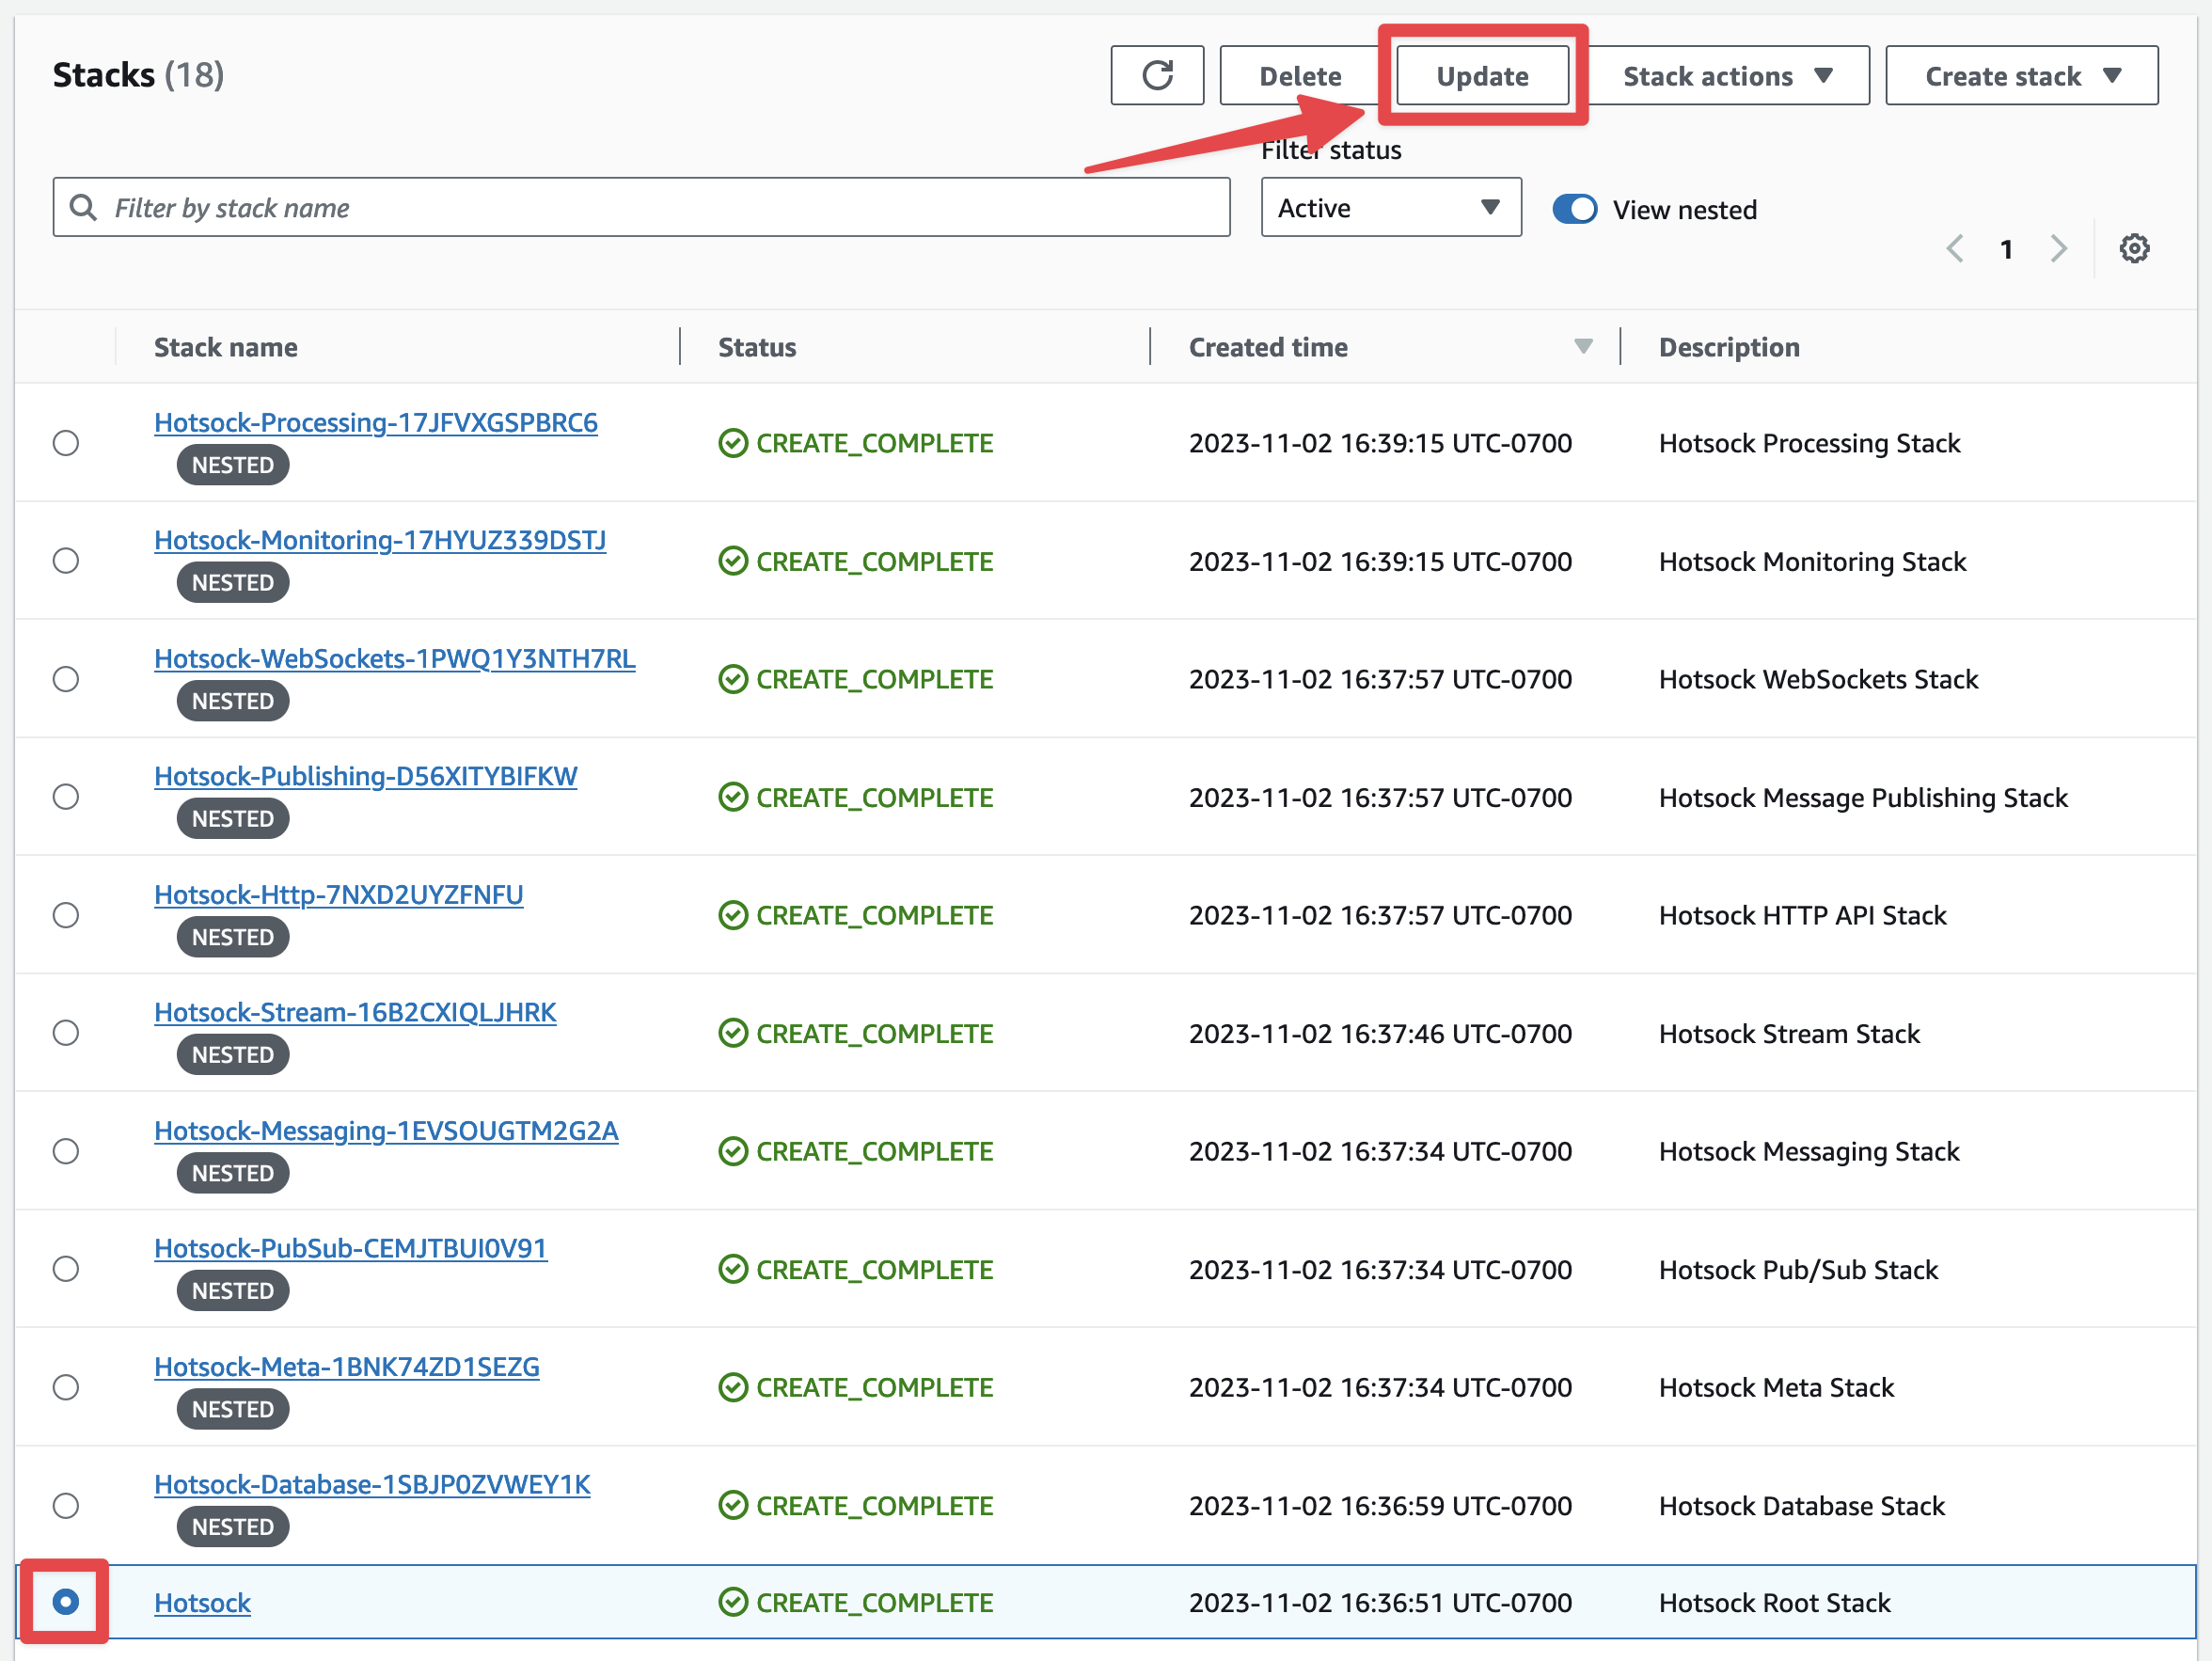
Sign into your AWS account as a principal with administrative permissions and open the CloudFormation console. Find the root Hotsock stack and click on its radio button. There are many Hotsock stacks marked as "nested", you'll want to ignore those and find the root stack that is not marked as nested.
In the upper-right, click the "Update" button. Conveniently, if you accidentally try and update a nested stack, it will suggest that you instead go to the root stack.
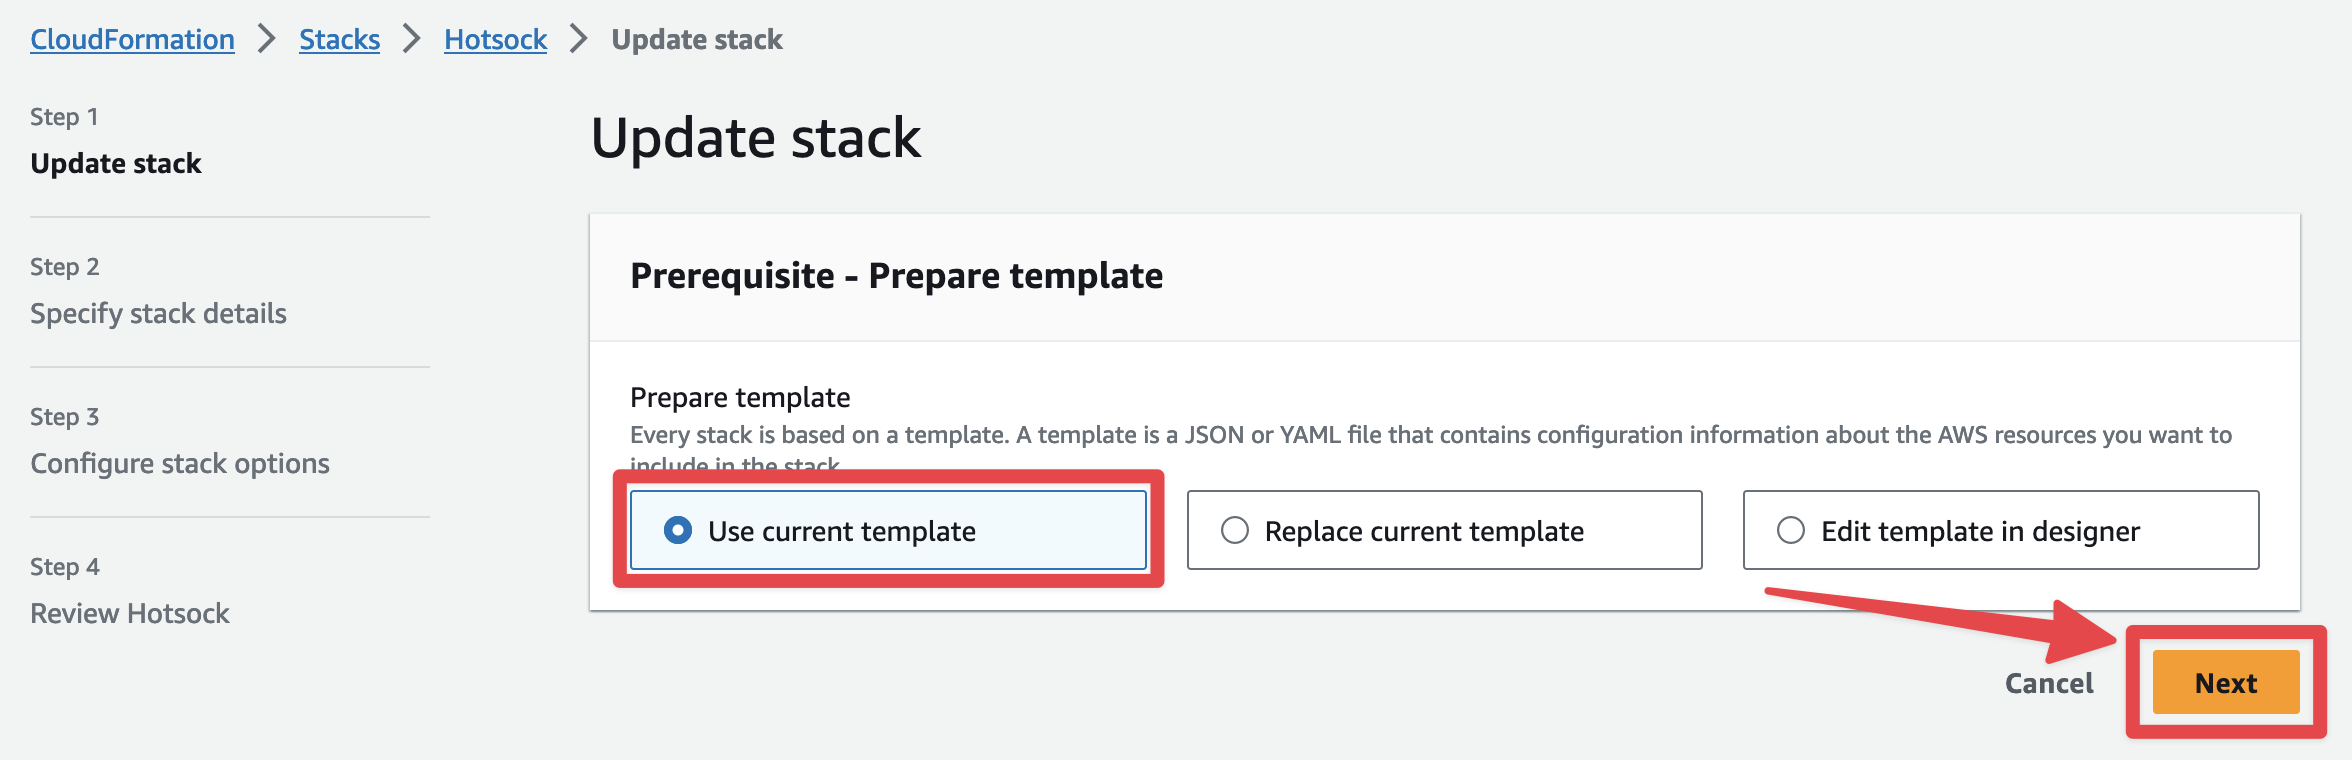
You'll be prompted with the "Prepare template" screen and can keep "Use current template" selected and click "Next".
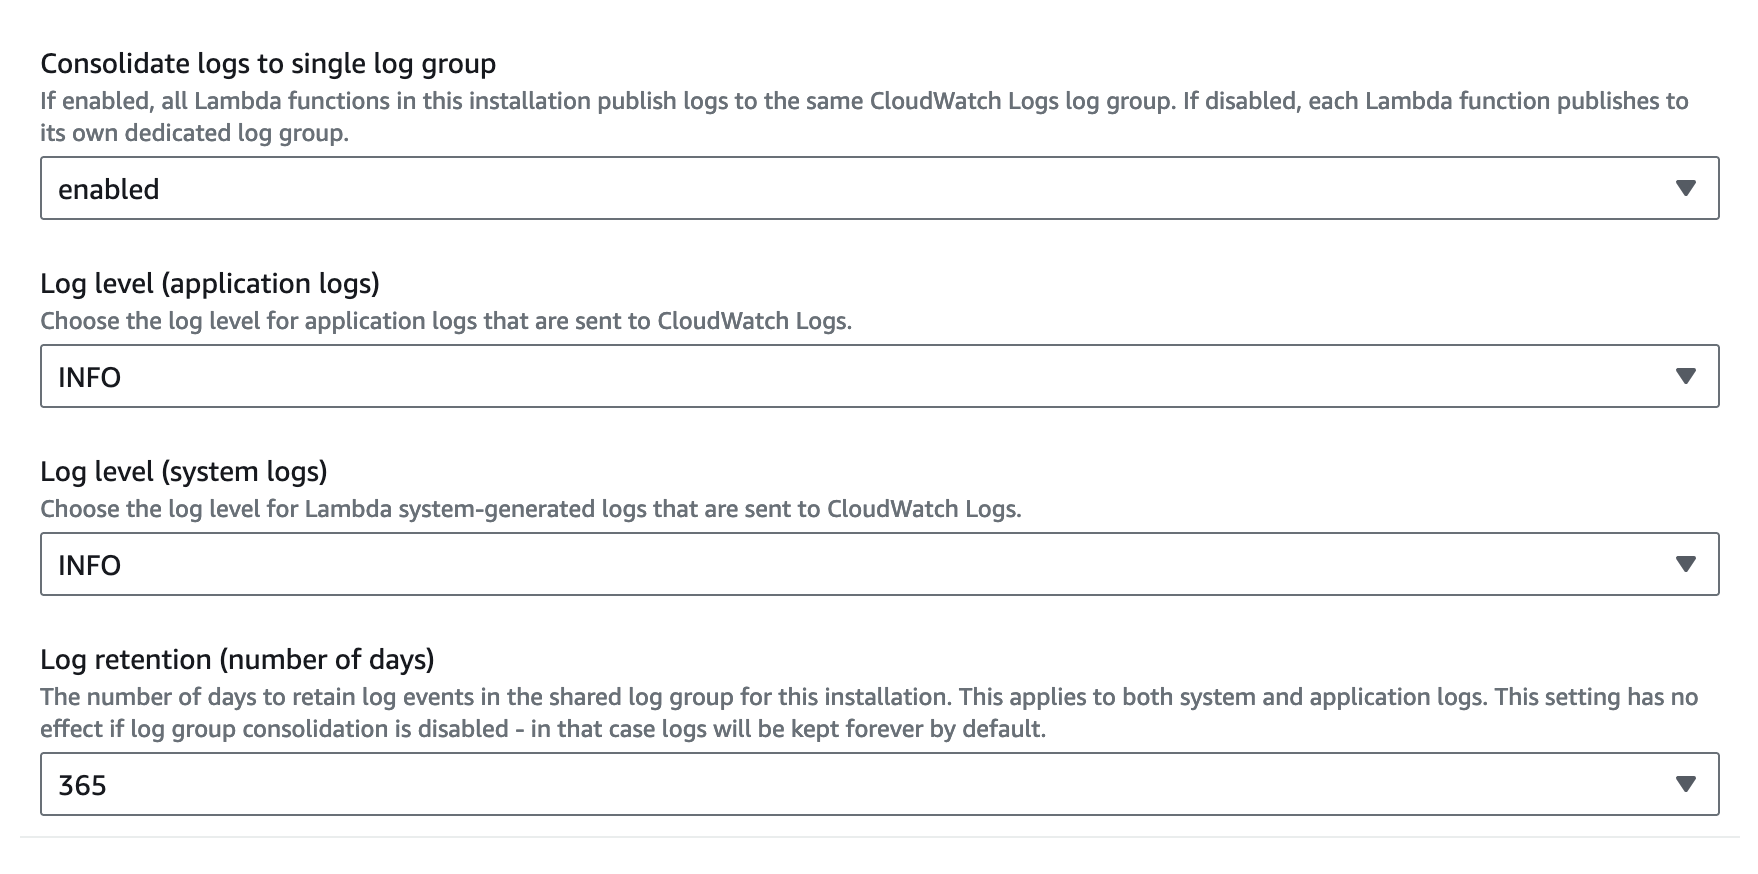
On the "Specify stack details" screen, you can configure "Consolidate logs to single log group", "Log level (application logs)", "Log level (system logs)", "Log retention (number of days)", and "Tracing spans in logs sample rate (%)".
Once you're satisfied with your choices, you can update the stack with these new settings.
- Scroll to the bottom and click "Next".
- Scroll to the bottom of the "Configure stack options" screen and click "Next".
- Scroll to the bottom of the "Review Hotsock" screen, check all the boxes in the "Capabilities and transforms" section and click "Submit".
The setting is applied immediately and logging changes will apply as soon as the stack update completes.